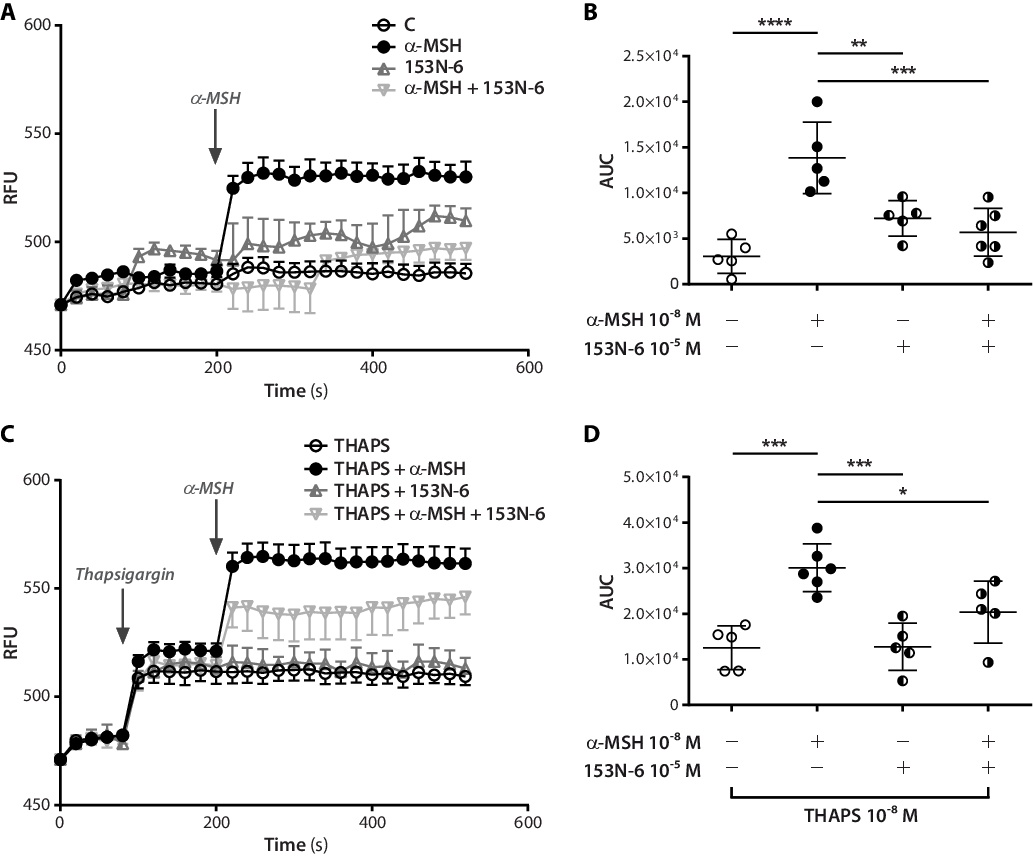
Fig. 4. MC1R activation increases intracellular calcium levels in migrating HAoECs. (A) Treatment with α-MSH after insert removal in the cell migration assay induced a prompt increase in intracellular Ca2+ levels (as detected by Fluo-4 NW fluorescent calcium indicator), which was completely abolished by pre-treatment with the MC1R-antagonist 153N-6. (C) Rise of intracellular Ca2+ in response to the stimulus with α-MSH was not prevented by prior stimulation with thapsigargin (THAPS). This was inhibited by pre-treating HAoECs with 153N-6. Arrows indicate thapsigargin or α-MSH stimulation. Curves present the mean ± SEM of n = 5-6 independent experiments. RFU, relative fluorescence unit. (B, D) The areas under the curve (AUC) were used to compare α-MSH-induced effects with control treatments. Results are shown as scatter dot plots and mean ± SD Statistical significance of differences was assessed by one-way ANOVA [(B) F(3,17) = 14.56, p<0.0001; (D) F(3,16) = 12.50, p=0.0001] with Tukey's post-hoc test (*p<0.05, **p<0.01, ***p<0.001, ****p<0.0001).